TSLA: My Brutally Honest Take on Tesla's Technical Situation
TSLA's brutal downtrend to $230 shows technical extremes: RSI at 24.49, strong bearish DMI, yet intriguing volume patterns suggest potential relief rally. A trader's candid perspective on navigating Tesla's volatility with lessons from past mistakes.

Scribbled together on March 12, 2025 - probably while I should've been working on client reports
Alright, I need to talk about Tesla because, frankly, it's been living rent-free in my head since that massive selloff last week. I've traded TSLA on and off for years (sometimes brilliantly, sometimes catastrophically), and this current setup is giving me serious déjà vu to late 2022.
Let me break down what I'm seeing in the technicals, where things might be headed, and why I'm both terrified and slightly intrigued by this stock right now.
The Price Action: Ugly But Getting Interesting
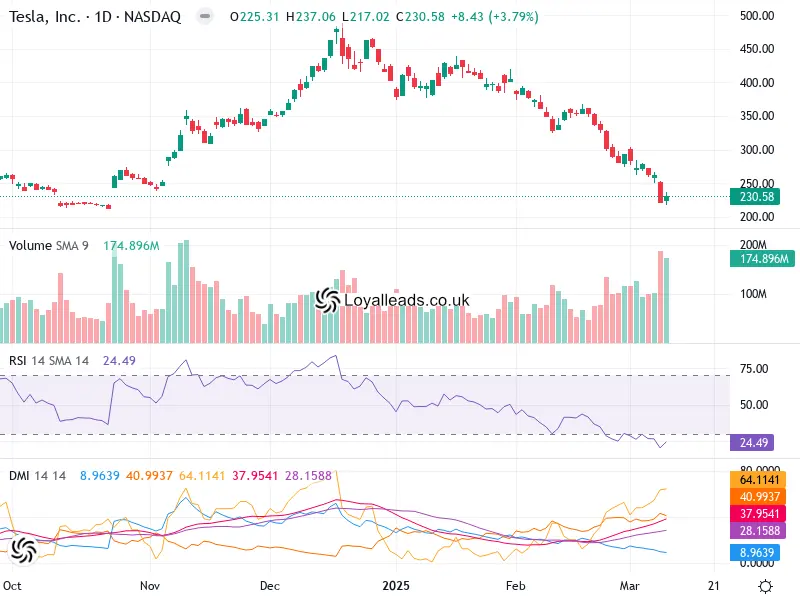
Look, there's no sugarcoating it—TSLA has been absolutely hammered. From its glory days around $450 to where it sits now at a humbling $230.58, this has been a textbook downtrend that's crushed many a permabull. You can practically hear the Tesla Twitter crowd crying into their commemorative Cybertruck mugs.
The daily chart tells a pretty brutal story:
- A relentless downtrend that's taken no prisoners
- Recent consolidation around the $230 level (which, coincidentally, is where I panic-sold back in 2020... right before it rocketed higher. Still bitter about that one.)
- Some evidence of support forming at current levels with higher volume
- Yesterday's candle showed a bullish reversal attempt (+3.79%), which perked up my interest
The intraday range was $217.02 - $237.06, which is the kind of volatility that makes this both terrifying and potentially profitable. That's a solid 9% swing in a single day for a mega-cap stock. Insane.
RSI: Screaming Oversold (But That Doesn't Mean "Buy Now")
I've been trading long enough to know that "oversold" doesn't equal "buy immediately." But damn, TSLA's current RSI of 24.49 is definitely raising my eyebrows. For those who don't obsessively check technical indicators like I do (get a life, unlike me), anything below 30 is traditionally considered oversold territory.
At 24.49, we're talking seriously oversold—like "left your phone at home on vacation" levels of disconnection from recent price action.
The thing is, I've seen TSLA ignore oversold RSI signals before. Back in summer 2021, the RSI stayed under 30 for nearly three weeks while the stock kept drifting lower. Painful lesson learned: Tesla doesn't always play by technical rulebooks.
That said, I'm not seeing any significant bullish divergence yet—which would be RSI making higher lows while price makes lower lows. That's typically my preferred entry signal for oversold conditions. But there's potential brewing here if the price can stabilize.
DMI is Straight-Up Bearish (No Ambiguity Here)
If RSI is giving us a glimmer of hope, the Directional Movement Index (DMI) is like that brutally honest friend who tells you your new haircut looks terrible. The readings are crystal clear:
- +DMI: ~28.15 (bullish pressure)
- -DMI: ~40.99 (bearish pressure)
- ADX: 64.11 (trend strength)
For those who don't speak indicator-ese, the -DMI being substantially higher than the +DMI means the bears are firmly in control. And that ADX reading of 64.11? That's off-the-charts high, indicating a crazy strong trend.
I've rarely seen ADX readings above 60 in my trading career—maybe 5-6 times in a decade? When I do see them, it usually means the trend (in this case downward) has real staying power. Not what bulls want to hear.
Volume: Actually Kinda Interesting
Here's where things get more nuanced. Volume often tells a different story than price, and I'm seeing some interesting signals here.
Current volume is sitting at 174.89 million shares, which is substantial even for TSLA. What catches my attention is the volume pattern:
- Heavy volume during the recent decline (typical)
- BUT yesterday's bounce came with strong volume too
This is potentially significant—sometimes heavy volume on a reversal day can signal capitulation (where the last desperate sellers finally throw in the towel). I'm not saying that's definitely what happened, but it's on my radar.
I remember a similar volume spike in October 2022 right before TSLA bottomed and then doubled over the next six months. Not saying history repeats exactly, but these patterns do rhyme sometimes.
OK So What's My Actual Take?
If I'm being honest (and why write this if not to be honest with myself), I think TSLA remains in a primary downtrend but is setting up for a potential relief rally. The technicals suggest we could see a bounce, but I'm skeptical about any immediate reversal of the larger bearish trend.
Key levels I'm watching:
- Support: $217 (yesterday's low, needs to hold)
- First resistance: $237 (yesterday's high, need to break above)
- Second resistance: $250 (psychological round number that'll attract attention)
For my own trading (not advice—seriously, who takes stock advice from random notes like this?), I'm considering a small long position with a tight stop below $217. My target would be around $260, giving me a risk/reward of roughly 1:2.
Why not wait for more confirmation? Because by the time all the indicators line up perfectly, the easy money is usually already made. Sometimes you gotta make calculated bets when things look terrible but might be nearing exhaustion.
That said, I'm keeping position size small because fighting strong downtrends has historically been a great way for me to donate money to the market. Never forget that time in 2019 when I thought I was smarter than the trend... spoiler alert: I wasn't, and my account paid the price.
The Fundamental Backdrop
Technicals aside, there's actually a lot happening with Tesla fundamentally that's worth considering:
- Q1 deliveries expected soon (~500k vehicles if they hit targets)
- Cybertruck deliveries ramping up (though with typical early production hiccups)
- Musk hinting at that mythical $25k Model 2 again (I'll believe it when I see it)
- Autonomous driving making regulatory progress
- Energy storage business actually growing impressively
- BUT margins getting squeezed and competition intensifying
How all these cross-currents resolve is anyone's guess, but it adds an interesting layer to the technical setup.
My Game Plan
I'm still mostly on the sidelines with TSLA, but getting increasingly interested. My plan is:
- Watch for confirmed break above $237 on good volume
- Look for RSI to climb back above 30 and start trending higher
- Keep an eye out for a potential +DMI/-DMI crossover (though that could take weeks)
- Consider a starter position if 1 & 2 happen, with a stop below $217
- Add if the trend starts improving, targeting $260-$300 zone
Will I stick to this plan? History suggests maybe not. I have a terrible habit of either pulling the trigger too early or chickening out entirely. That time in 2021 when TSLA dropped to $560 and I had a buy order at $555 that never filled before it rallied back to $700... still hurts.
Final Thoughts
Tesla remains one of the most technically tradable stocks out there—massive liquidity, great volatility, and enough true believers and dedicated haters to create interesting price action. Its current technical setup suggests we're at an inflection point, but remembering the strength of the downtrend is crucial.
For me, risk management trumps conviction here. I've been burned by "obvious" Tesla setups before, so I'm approaching with caution. Small position size, clear stops, and predefined targets are the only way I'll wade into these waters.
I'll probably revisit this analysis next week to see how wrong I was. Trading keeps you humble that way.
Disclaimer: I'm just some person who stares at charts probably more than is healthy. This isn't financial advice, just my personal musings. Always do your own research and never trade based solely on some random analysis you found online. Seriously, that would be crazy. Also, I might actually own some TSLA shares at time of writing because I never learn my lesson.